Under the Hood: Prioritizing Technical Debt in React
Let's have a look at one of the technical debt examples. Prioritizing tech debt on a function level is a big win. We'll explore React codebase.
Behavioral code analysis is a young discipline. One of its sweet spots is to detect, prioritize, and manage technical debt based on data from how developers interact with the code.
In this article we put the technique to use on theReactJavaScript library from Facebook to detect technical debt and suggest possible actions.
Detect Hotspots in React - how to measure technical debt?
React is a popular JavaScript library for building user interfaces, and we are using it ourselves at Empear. As such, I’m familiar with React as a user and I like the programming model. React is an important step forward. However, I never looked under the hood at the actual code. Normally, this would be a daunting task given the ~130,000 lines of code in React. Not so with a behavioral code analysis; by building a hotspot map, we get a quick overview of the codebase and immediately know where the most interesting modules are. Let’s have a look at React using theCodeScenetool to automate the analyses.
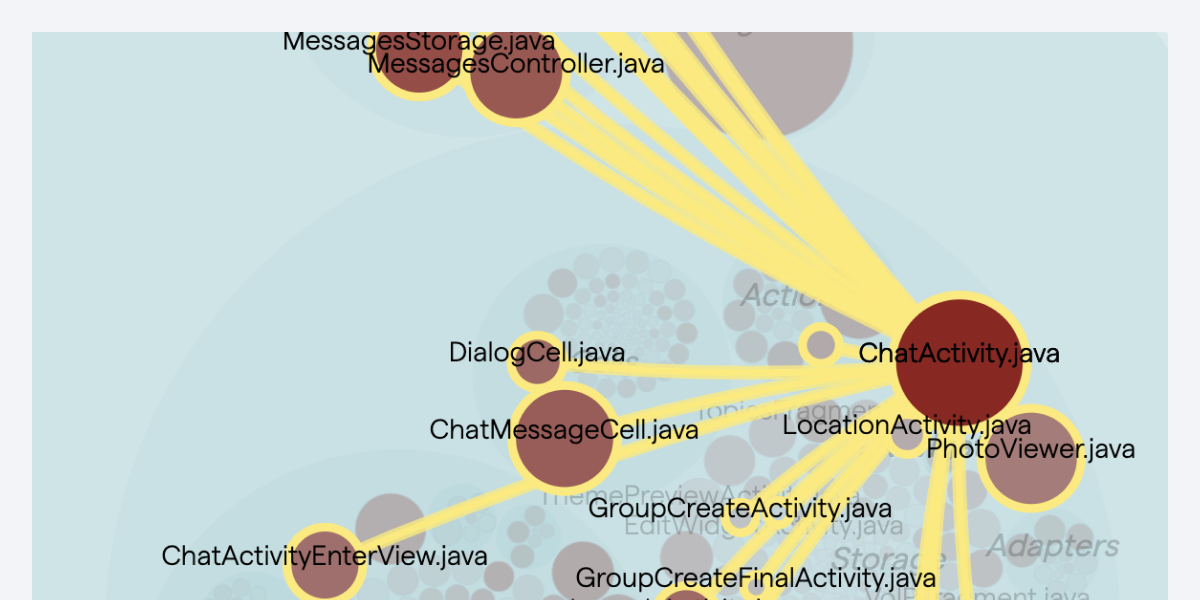
Prioritized hotspots have high development activity and a declining code health.
The visualization shows that there is a cluster of hotspots in thereact-reconcilerpackage. Zooming in on that package reveals a prioritized hotspot,ReactFiberBeginWork.js, where most of the development activity has taken place over the past year. This dimension is used to prioritize; if a piece of code is worked on a lot, it’s likely to be important and have a high business impact. It’s a development hotspot.
However, just because something is a hotspot doesn’t mean it’s a problem. To dig deeper, CodeScene presents aCodeHealthscore. The Code Health score is an aggregated metric that aims to identify code that is expensive to maintain and at risk for defects. The Code Health scale goes from10(best) down to1(code that’s likely to have severe maintenance issues).
When analyzing code, I tend to emphasize trends over absolute values. As such, I’m more interested in thedirectiona hotspot evolves – is it getting better or worse – than any specific metric in isolation. Along that line of reasoning, I would conclude that based on what we have seen so far,ReactFiberBeginWork.jsis likely to be a good refactoring candidate because:
It's relevant: ReactFiberBeginWork.js is a hotspot, which means the organization works with the code regularly,
It has a low Code Health: That regular work is likely to be more expensive and pose higher risk than necessary, and
It is degrading: The trends indicate that as ReactFiberBeginWork.js is worked on, its code health declines. This is evident by the historic code health score in the preceding figure, which shows that over the past year the code health has declined from 4 down to 2.41.
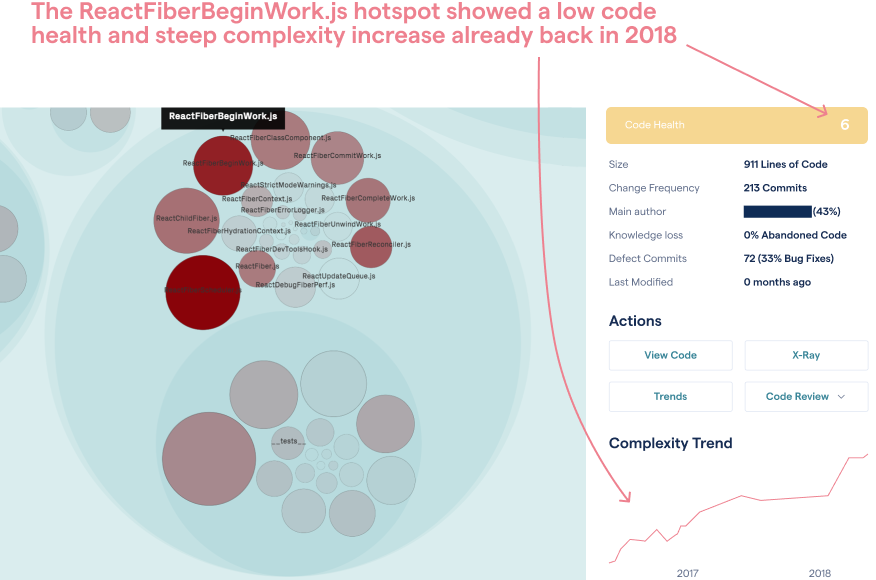
Now, before we dig deeper I’d like to share a related discovery.Codescene.iohas the React codebase as a publicshowcase analysis. You can follow the demo project here (use desktop). Below we see a historic snapshot of React as it looked in 2018. This makes for an interesting comparison, so let’s look at the historic findings on theReactFiberBeginWork.jshotspot:
Historic analysis results for the current React hotspot.
Fascinating! The code seems to have been much simpler back in 2018, but the warning signs of a growing hotspot were all there. There’s not much we can do about that now, except following the old proverb: The best time to refactor a hotspot was last year. The next best time is today. Now, let’s get back to the present day and see how to make that task actionable.
Tip: Use Behavioral Code Analysis for on-boarding and to prioritize technical debt
A hotspot map helps you build a mental model of what a codebase looks like. Within minutes, you have a visual representation of the system that provides context and guides explorations. A hotspot analysis helps you focus on the weak spots in the system that you are likely to end up in sooner or later during coding.
Adam Tornhill is a programmer who combines degrees in engineering and psychology. He’s the founder and CTO of CodeScene where he designs tools for code analysis. Adam is also a recognized international speaker and the author of multiple technical books, including the best selling Your Code as a Crime Scene and Software Design X-Rays. Adam’s other interests include modern history, music, retro computing, and martial arts.
Subscribe to our newsletter
Lorem ipsum dolor sit amet, consectetur
adipiscing elit. Semper neque enim rhoncus vestibulum at maecenas.
Ut sociis dignissim.
Latest Articles
AI Coding Assistants: Introducing CodeScene AI Generated Code Refactoring
AI Coding Assistants: Let's introduce you to AI generated code refactoring. Read more and join the Beta testing program.
Change coupling: visualize the cost of change
Code can be hard to understand due to excess accidental complexity. Or, it can look simple, yet its behavior is anything but due to complex...
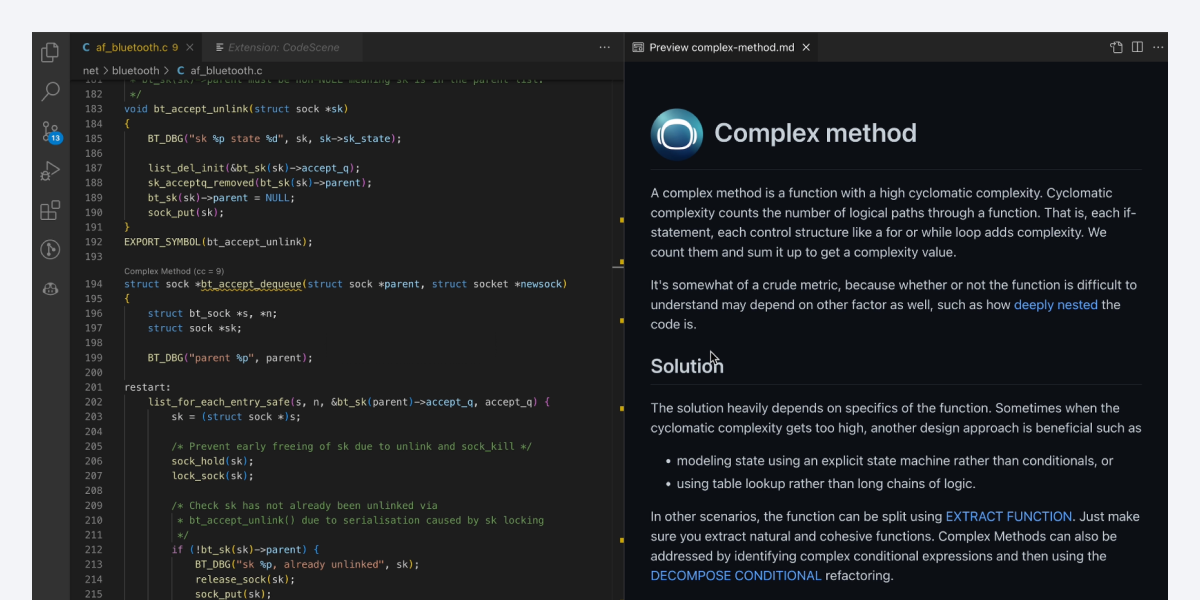
CodeScene's IDE Extension brings CodeHealth™ Analysis directly into your...
We've just launched an IDE Extension for VS Code, helping developers tackle code complexity within the editor. Read more and try it out!

 Prioritized hotspots have high development activity and a declining code health.